
Best Reporting Tools For Your Business
No matter the nature of the business you’re running, you’ll likely find yourself drowning in numbers, metrics, and financial data.
Accurate and insightful reporting aims to visualize and disaggregate data in a meaningful way to influence decision-making. The larger and more complex the data is, the harder it’ll be to put it to good use.
Reporting software enables simplified data analysis and visualization, providing you with a more insightful view of what’s happening in your company.
In this guide, I’ll walk you through some of the best reporting tools to help you decide on the right one for your organization.
The Best Reporting Tools in 2023
After extensive research and trying out many tools myself, I think that the best reporting tools on the market are Wrike, Zoho Analytics, Google’s Looker Studio, WhataGraph, and Tableau. Now, let’s take a closer look at how these tools can help you make better decisions for your organization.
Wrike – Best Overall Pick
Overview
Wrike is a reporting solution that provides data-driven reports and facilitates team collaboration. It helps your team focus on the most vital areas in your company by getting rid of complexities.
Highlights
Dashboards: Visualize project data, processes, and analytics with insightful and easy-to-navigate dashboards.
Automation: Create automated workflows and assign workflow triggers to streamline your operations and increase productivity.
Cross-Tagging: View multiple work streams easily with cross-tagging capabilities.
Kanban Boards: Track project progress and build customized workflows with Kanban boards.
Gantt Charts: Use interactive project scheduling to manage your projects and assign tasks more effectively.
Functionality
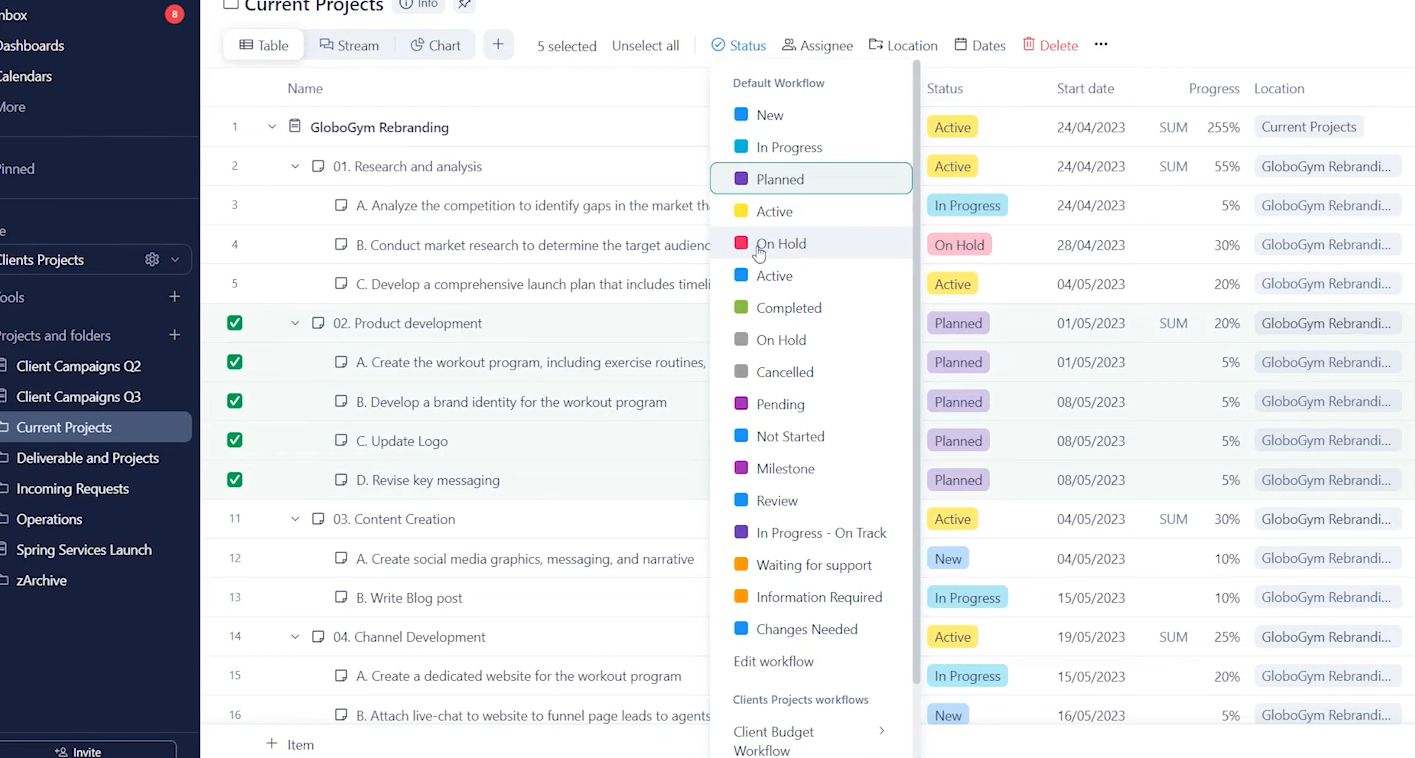
One of my favorite features in Wrike is the ability to take mass actions, which simply allows me to assign, delete, or change the status of multiple tasks at once.
To do this, simply tick the checkbox next to the tasks you choose and tap on “Status” in the top bar. Then, select what you want to do with these tasks and the action will be applied to all of them.
Pricing
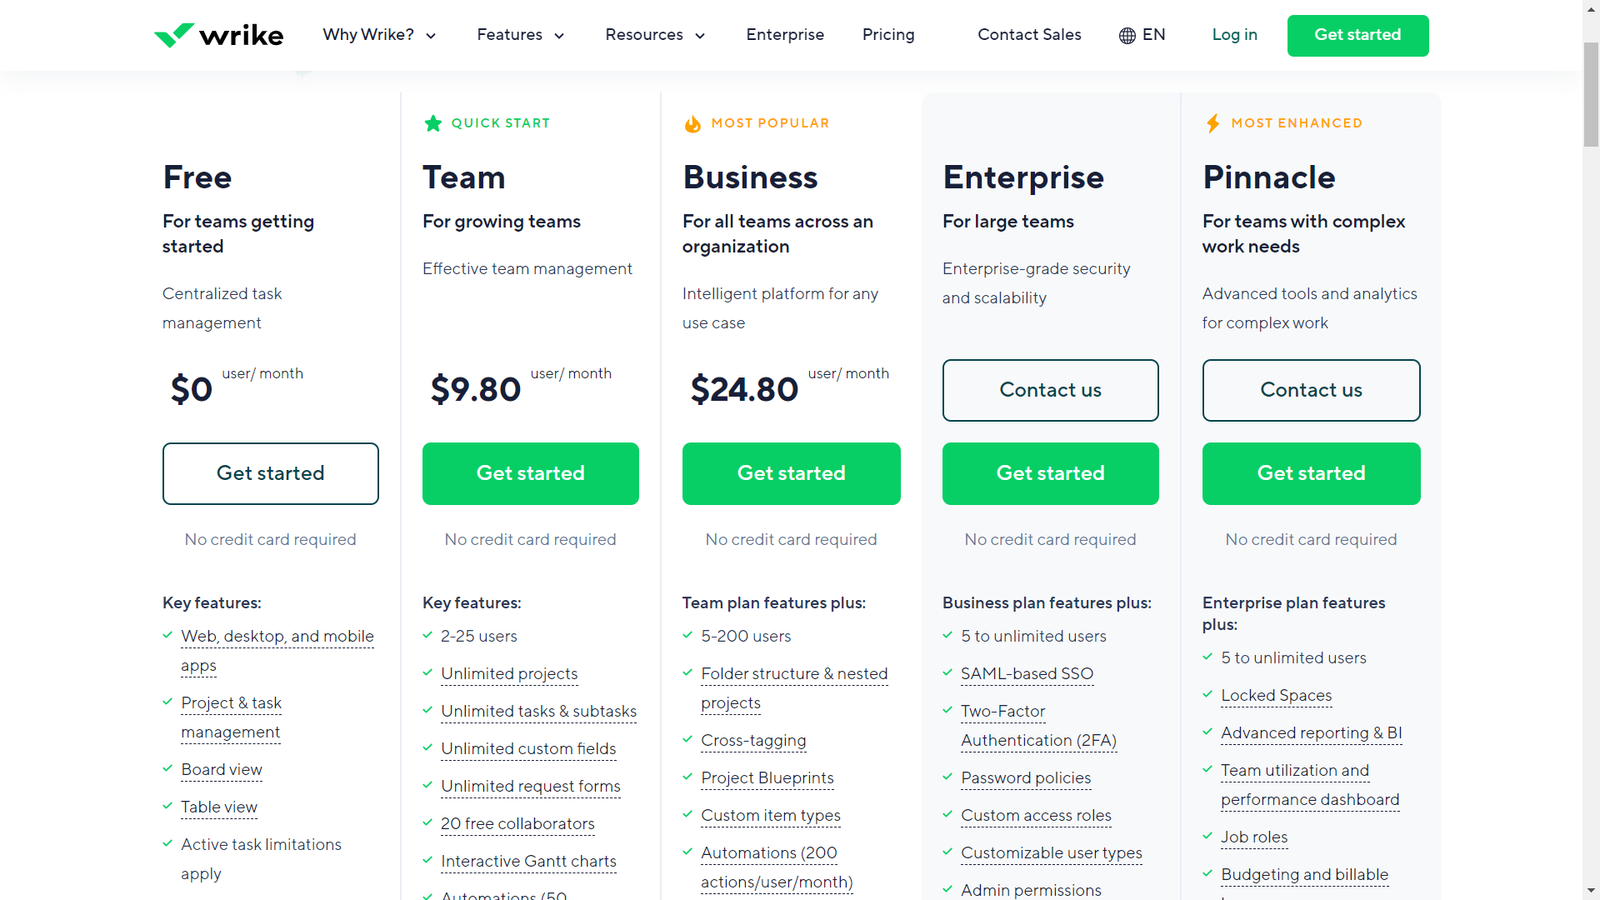
Wrike offers 5 plans to suit different team sizes and needs: Free, Team ($9.80 per user per month), Business ($24.80 per user per month), and Enterprise and Pinnacle (custom priced).
The Free plan provides centralized task management for teams starting out with active task limitations, while the Team plan offers effective team management for 2-25 users.
The Business plan provides an intelligent platform for 5-200 users with cross tagging and automations, while the Enterprise plan offers enterprise-grade security and scalability for 5 to unlimited users.
The Pinnacle plan, with advanced tools and analytics, is available for teams with complex work needs.
Customer Thoughts
I love the Gantt charts. They help us visualize project progress and keep our teams focused.
The best thing about Wrike is that I can easily see version histories and follow up with edits.
We use Wrike to create custom dashboards and group them into widgets to maximize efficiency, and it’s been working great for us so far.
The blueprints feature has saved us a huge amount of time as it helps us maintain process consistency.
Searching for conversations and files is somewhat complicated, especially if there are subtasks.
Wrik does offer the ability to hide blocked tasks in to-do lists, but it doesn’t actually hide them, which may create confusion for team members.
Bottom Line
From my experience, Wrike is among the best project management and data reporting tools for generating interactive reports and improving team efficiency. There’s a free plan that lets you start using the tool if your team is small.
Zoho Analytics – Runner Up
Overview
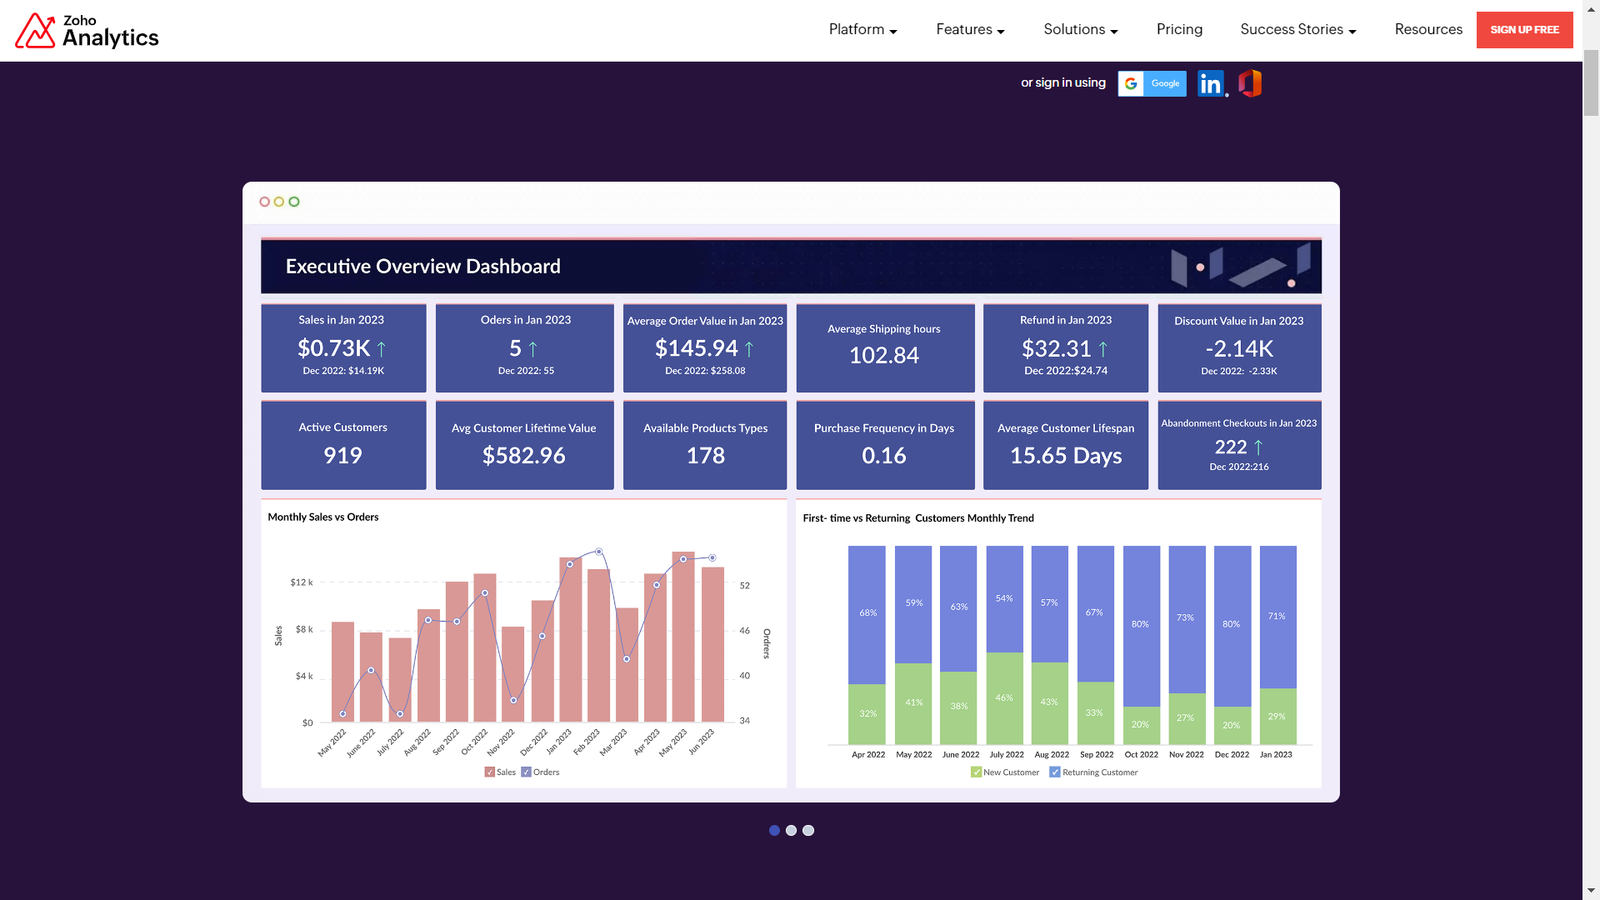
Zoho Analytics is a self-service business intelligence and analytics solution that helps you create and share insightful reports to support decision-making. It offers integrations, data storytelling, visualization, and more.
Highlights
Data Integration: Pull data from more than 250 data sources and prepare it for analysis.
Tabbed Dashboards: Put all of your reports in one place with tabbed dashboards that facilitate KPI tracking.
Augmentation: Utilize AI and machine learning with natural language processing to gain useful insights from your data analysis.
Collaborative Analytics: Enable collaboration and democratize data analytics with shareable dashboards and analytics.
Data Storytelling: Make your analytical insights more engaging and easier to understand by using simple business workflows that everyone is comfortable with.
Functionality
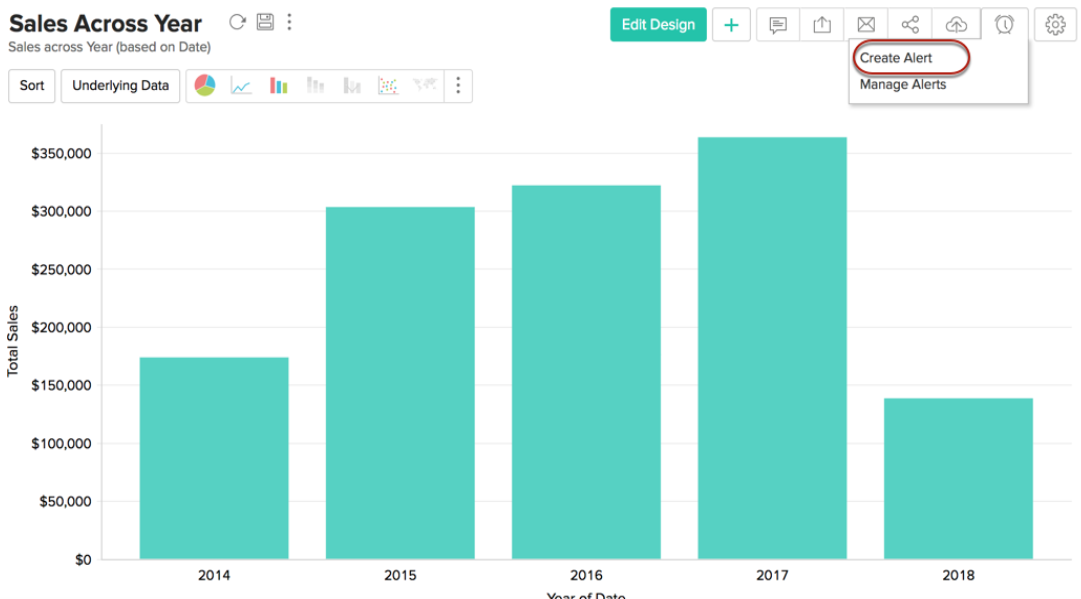
One handy feature in Zoho Analytics is the ability to set data alerts, which can definitely help in keeping track of essential business metrics. When data goes much higher or lower than the expected or normal value, the tool will send you an automated alert.
To create an alert, simply open one of your charts, click on the “Alerts” icon in the top right corner, and select “Create alert”.
Pricing

Zoho Analytics offers 4 pricing plans tailored to meet diverse analytical needs. The Basic plan starts at $25 per month and includes 2 users, accommodating up to 0.5 million rows. It provides unlimited reports, 250+ data connectors, daily sync, and more.
The Standard plan, priced at $50 per month, supports 5 users and 1 million rows, with additional features like hourly data sync, data alerts, and advanced slideshow capabilities. The Premium plan, at $125 per month, expands to 15 users and 5 million rows, offering advanced data preparation, Zia Insights, and an analytics portal add-on.
The Enterprise plan, costing $495, scales to 50 users and 50 million rows, with enhanced performance and dedicated support.
Customer Thoughts
The tool has been very helpful in generating project reports, integrating data and providing insights into our clients’ preferences.
We love that we can get the insights presented in the form of easy-to-understand and visually appealing infographics in Zoho.
Zoho Analytics has helped us set goals for our projects and track progress with ease.
The best thing about Zoho is that we can pull data from both cloud and on-premises sources.
Dashboards sometimes don’t sync properly with graphs, particularly when the source data is changed.
While Zoho lets us share reports, we wish there were more automated distributing options to S3, Zoho WorkDrive, and other destinations.
Bottom Line
In my opinion, Zoho Analytics is an excellent business intelligence software for demystifying data and presenting it in a simple way. If you haven’t used Zoho Analytics before, you can try out one of the plans with the 15-day free trial.
Looker Studio – Best Free Reporting Tool
Overview
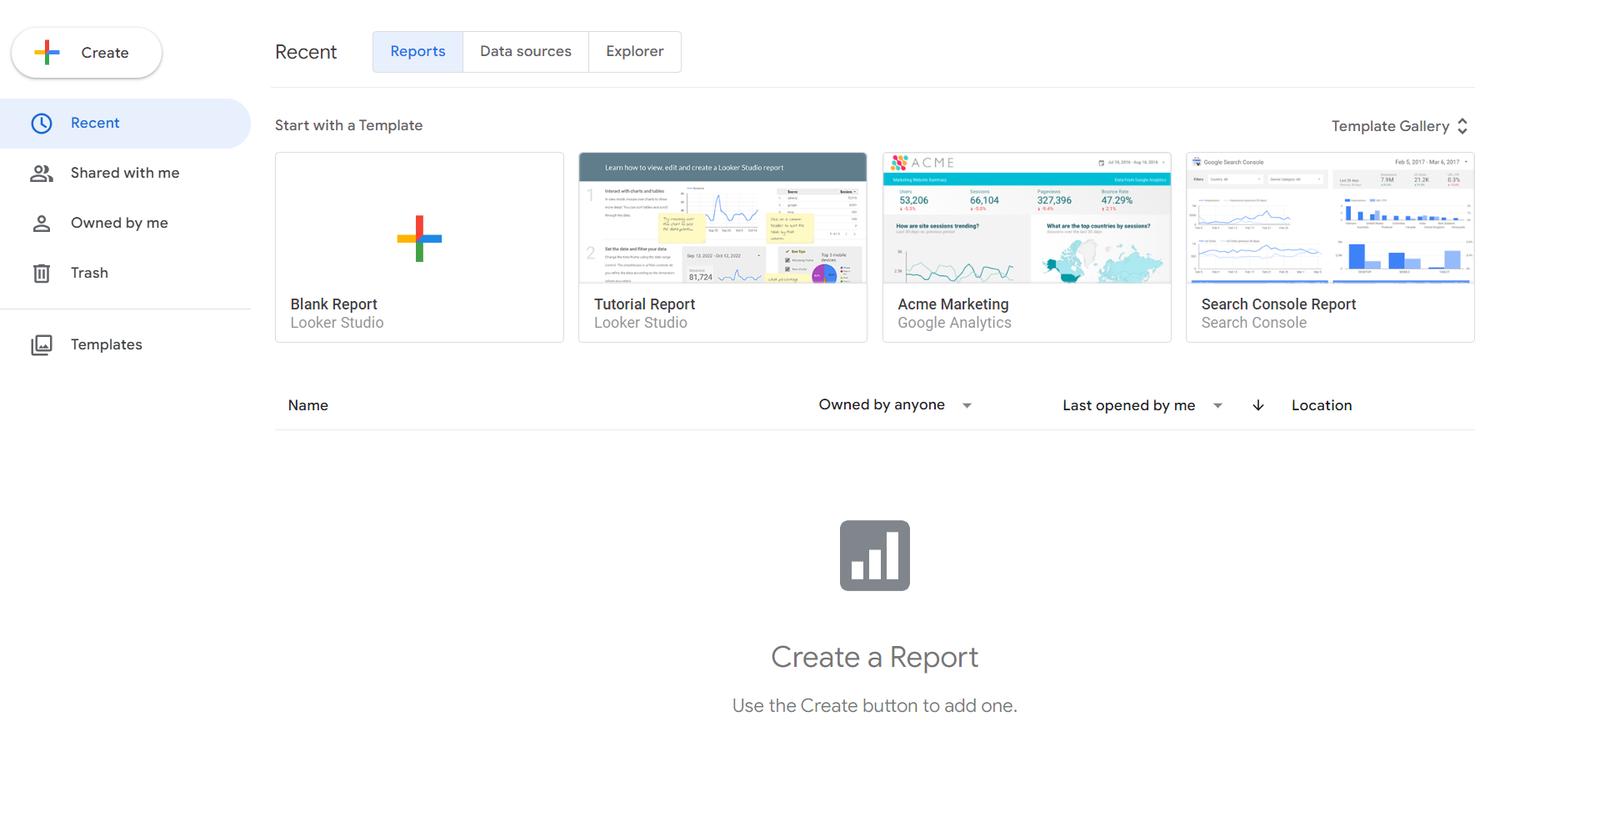
Google Looker Studio is a tool that enables you to transform raw numbers into easy-to-read visual graphs and charts. All you have to do is connect your data sources, and the tool will present them in a way that supports data-driven decision-making.
Highlights
Seamless Data Integration: Pull data from 800+ sources to keep your data analysis in one place.
Intuitive Smart Reports: Convert your data into actionable insights using intuitive smart reports.
Automated Dashboards: Provide your team with real-time insights and relevant metrics with shareable automated dashboards for real-time insights.
Collaborative Data Sharing: Share reports with teams, collaborate in real-time, and embed reports on the web to effectively communicate data insights.
APIs: Automate project management and simplify asset migration with Looker Studio’s free API access.
Functionality
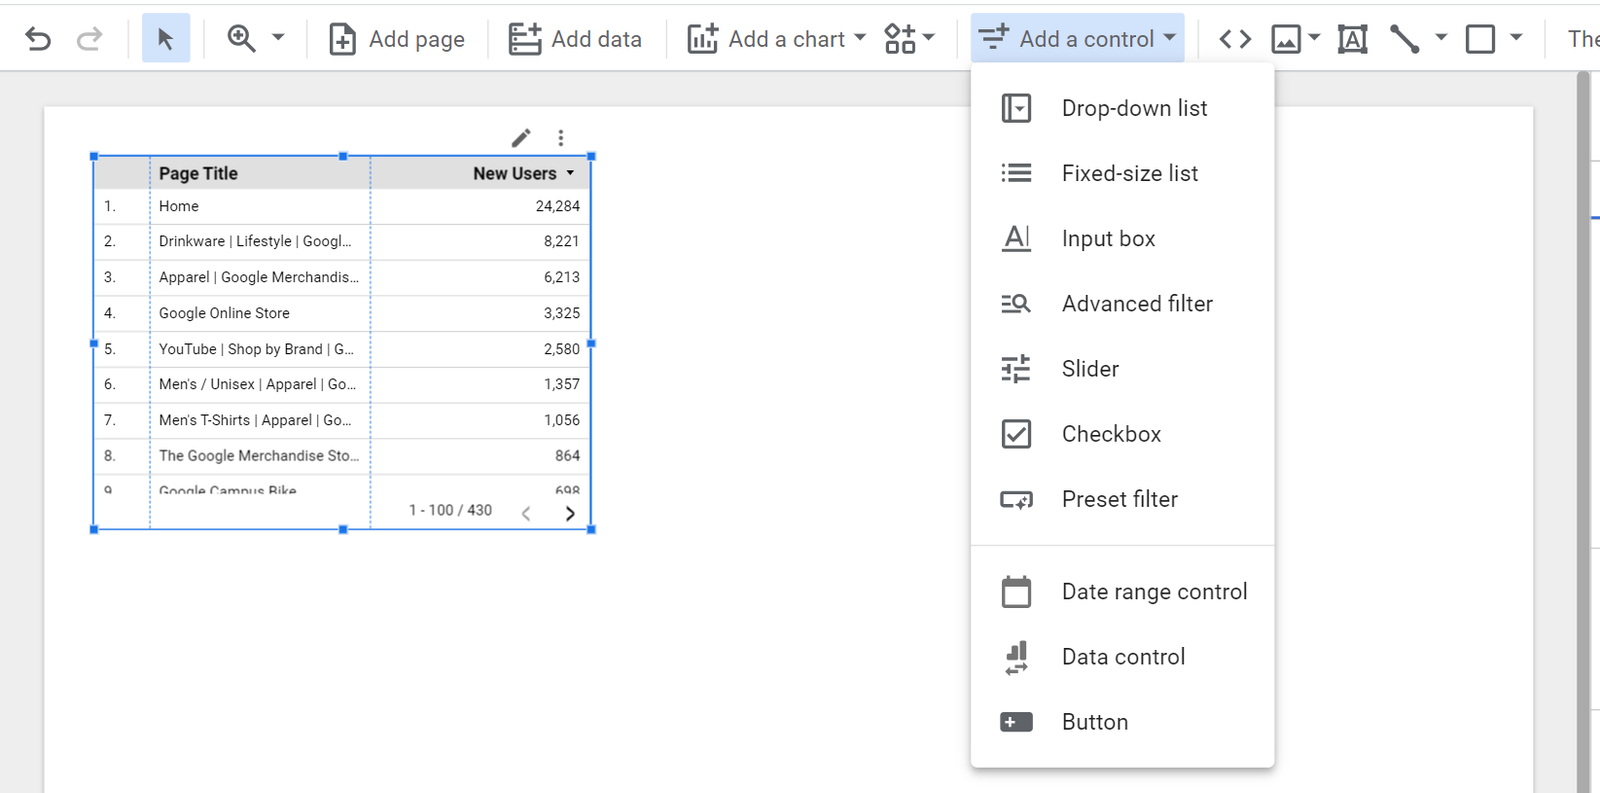
Looker Studio lets me add controls to my data, which helps organize data and break it down for analysis.
To add controls, simply tap on the “Controls” button in the upper toolbar and choose the control you wish to add.
Pricing
Using Looker Studio is free for individuals and micro-business owners. However, for larger enterprises that require advanced administrative and team management capabilities, Google offers a quote-based Looker Studio Pro package.
Customer Thoughts
The ability to combine and view data from Google Analytics, Google Ads, and Search Console in Looker Studio has saved us a lot of time and effort.
I like that Looker Studio makes it easy to share reports with teammates and stakeholders.
I use Looker Studio to quickly create and share interactive dashboards, and it hasn’t failed me once.
Looker Studio offers a lot for being a free tool, but if you stuff it with big data sets, it’ll struggle.
For us, Looker Studio wasn’t a reliable choice for handling complex queries.
Looker Studio has so many connectors for streamlined workflows across multiple platforms, which is surprising considering that it’s not a paid tool.
Bottom Line
If you’re looking for a free data reporting and visualization tool, Google Looker Studio seems like a pretty solid choice, considering that it won’t cost you anything.
WhataGraph – Best for Automation
Overview
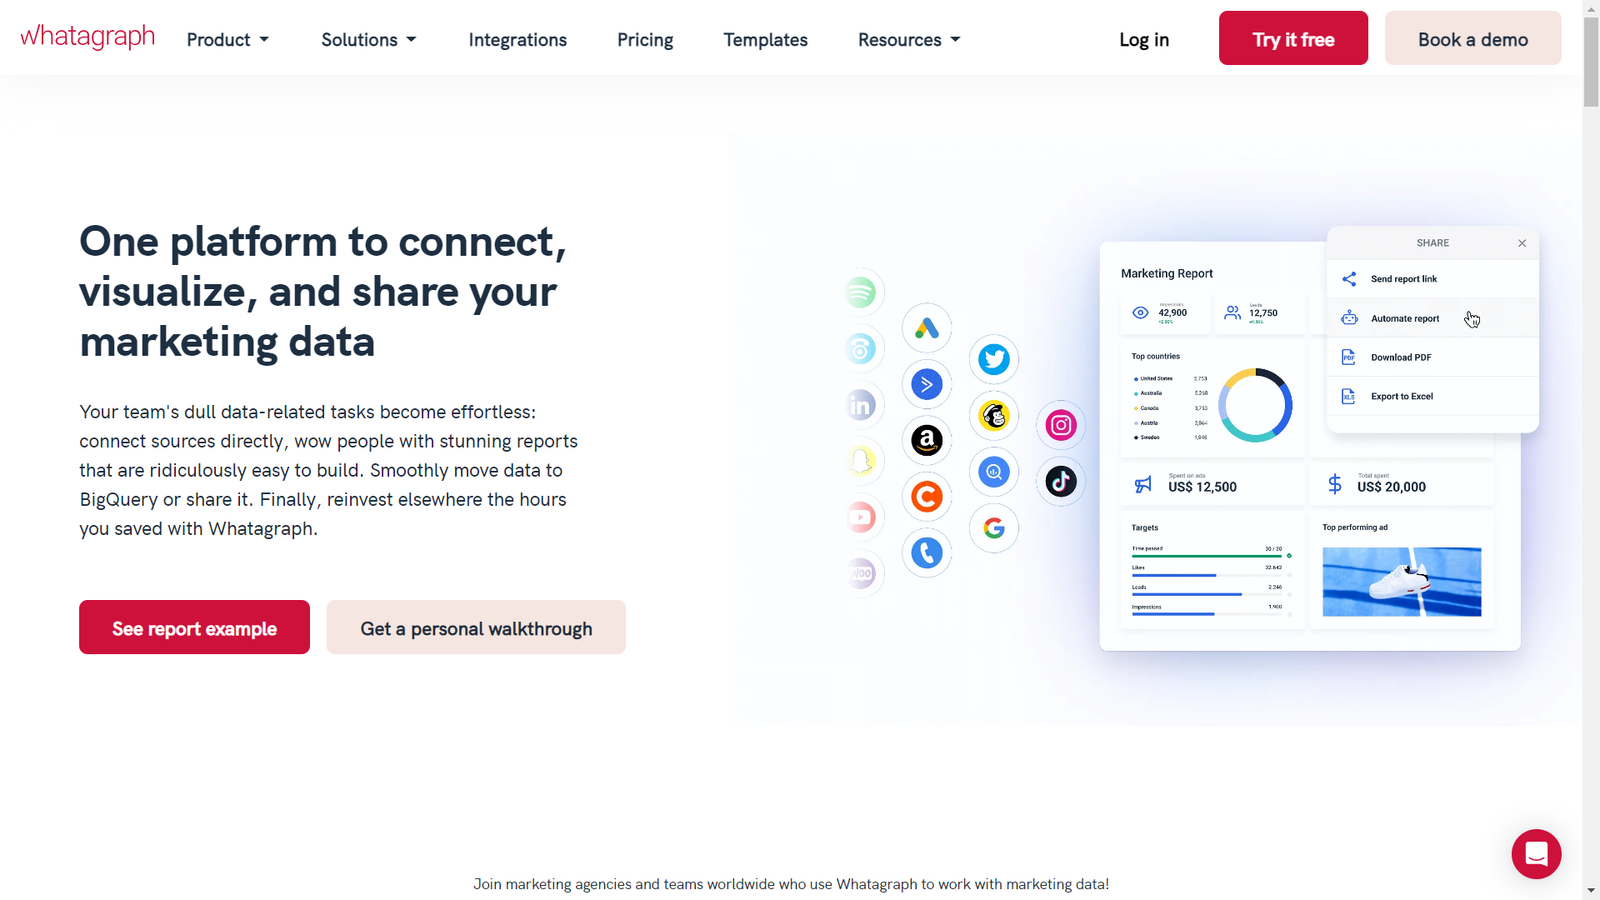
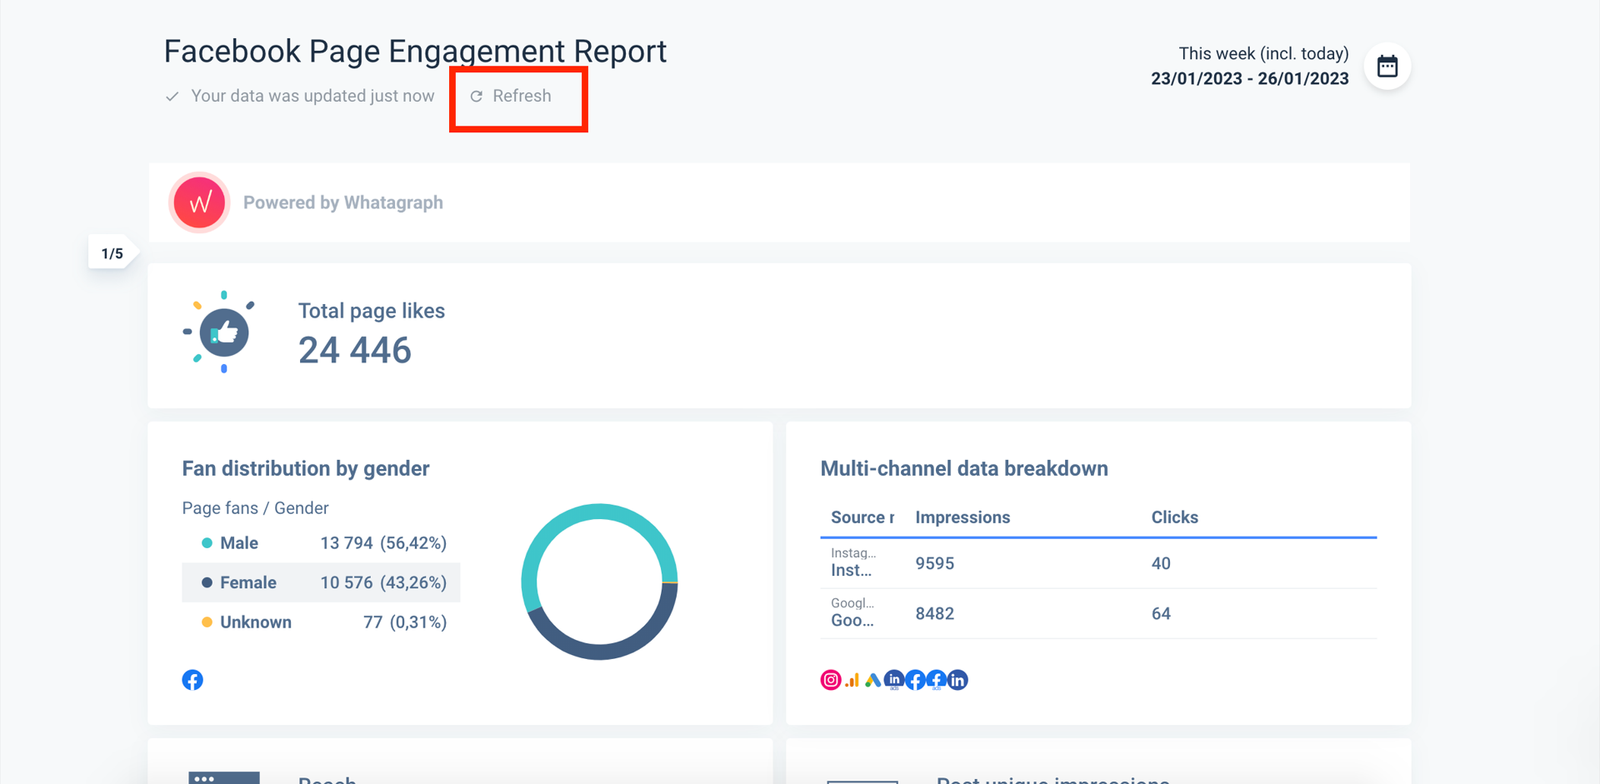
WhataGraph is a data visualization software platform that enables you to present, analyze, and share data in your organization. It boasts an intuitive drag-and-drop interface that lets you create dashboards and collaborate with your team effortlessly.
Highlights
Automated Data Connection: Connect to over 40 native integrations and pull near real-time data into your reports.
Easy Report Creation: Use templates or create reports from scratch using the Smart drag-and-drop builder with built-in customizations.
Automated Sharing: Schedule automated report sharing to enhance stakeholder collaboration.
Cross-Channel Reporting: Combine insights from multiple sources in one report to get a full overview of what’s happening in your company.
Widgets: Use pre-made and custom widgets to structure your reports the way you want.
Functionality
For me, the most useful feature I’ve found in WhataGraph is a much-needed refresh button. Apparently, the tool uses smart caching to ensure that the most recent report data can be made available when you use the refresh button.
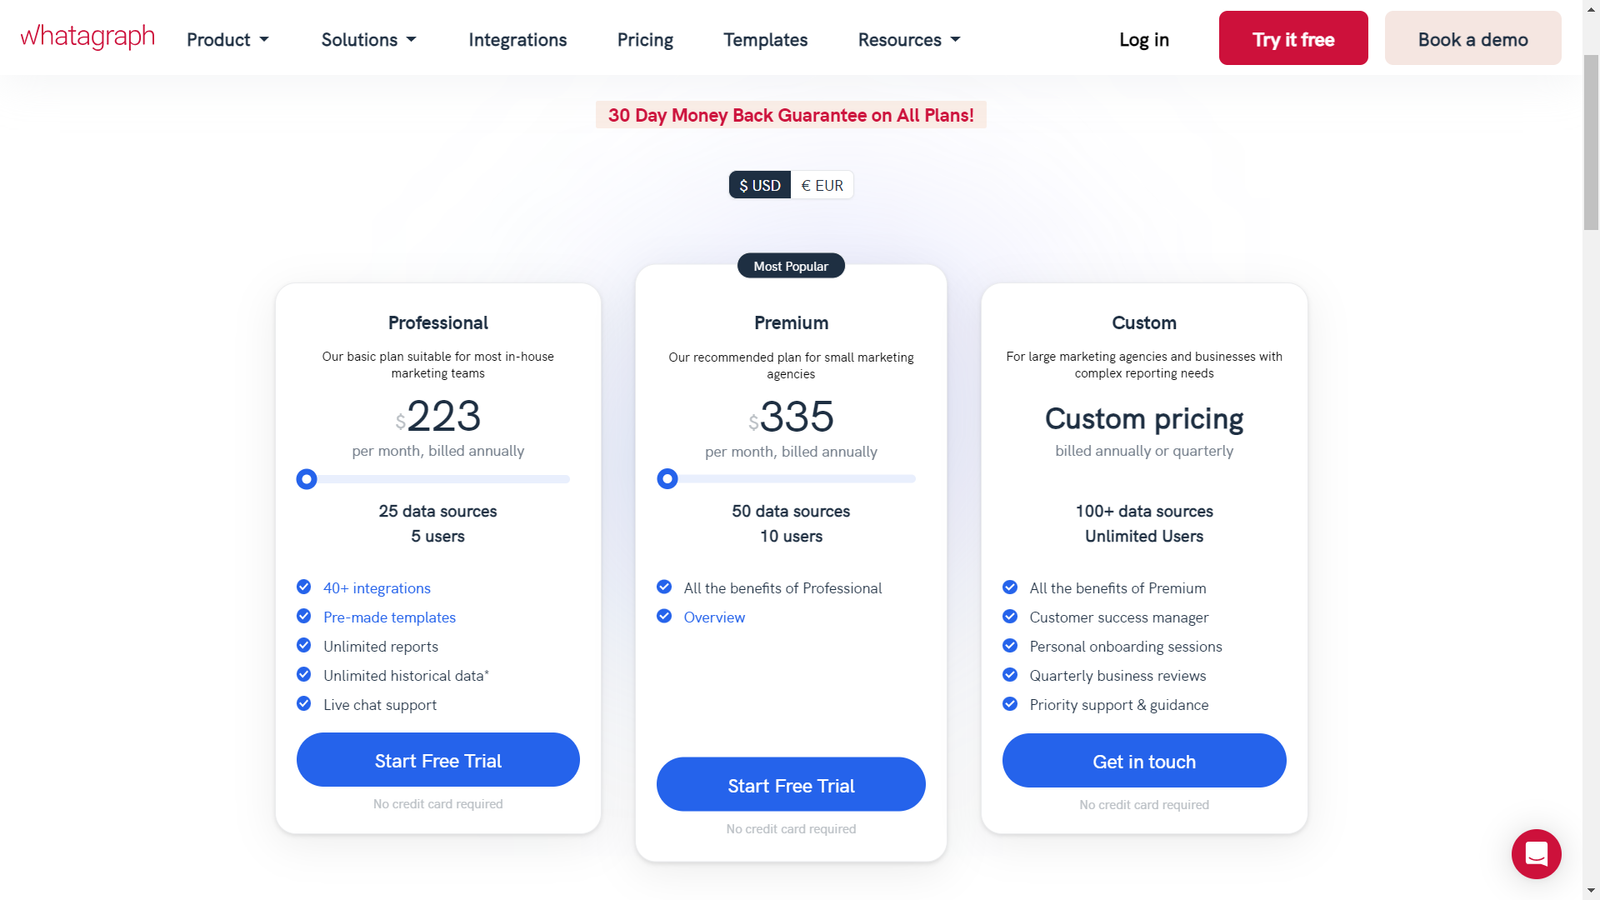
Pricing
Customer Thoughts
We love that the reports are automatically delivered to clients.
Branding your reports and making them look how you want is just very neat.
WhataGraph integrates with multiple data sources, so we never really have to pull data manually.
The scheduled import feature is a lifesaver for us! It’s like having a reporting tool on auto-pilot.
Sometimes, the source would randomly disconnect, affecting the accuracy of our reports.
The widgets help me customize each report’s look based on the nature of the data it contains, which is pretty sleek.
Bottom Line
While WhataGraph is far from being a budget-friendly reporting tool, its integration, automation and scheduling capabilities make it well worth it. There’s a free trial that lets you explore its features yourself.
Tableau – Best for Complex Data Analysis
Overview
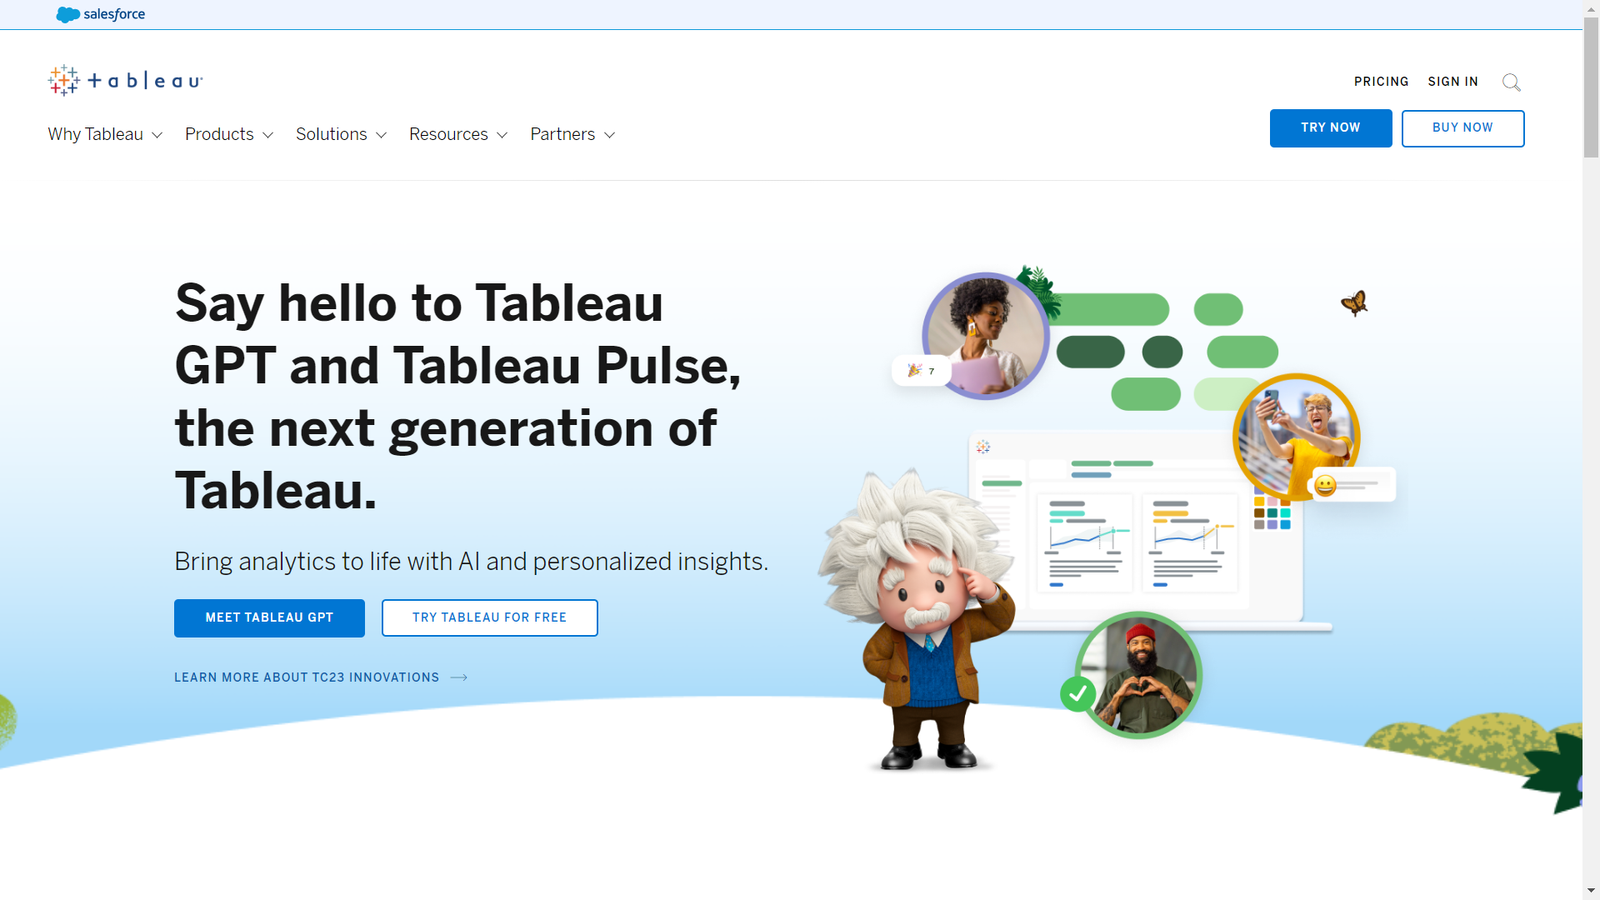
Tableau is a business intelligence and analytics platform that enables you to analyze business data and gain useful insights from different data sources. It offers interactive dashboards and dynamic visual analytics to help decision-makers identify patterns and trends, in addition to keeping track of vital business metrics.
Highlights
Ask Data tool: Ask questions about your data in natural language and get useful responses that help you gain insights.
Connectivity with live and in-memory data: Create both live and in-memory data connections to optimize direct data consumption, performance and offline analysis.
Advanced data visualizations: Tableau offers both simple charts and complex graphs to present your data the way you want.
Mapping capabilities: Create data maps with customizable geographical layers, choropleth maps, heat maps, flow maps, and point distribution maps.
Trend lines and predictive analysis: Create trend lines and forecasts with parameter setting and drag-and-drop operations.
Functionality
In Tableau, you can create a “story”, which is a series of visualizations and graphs that deliver information intuitively.
To create a story, click the New Story tab and choose a size for your story from the bottom-left corner.

Pricing
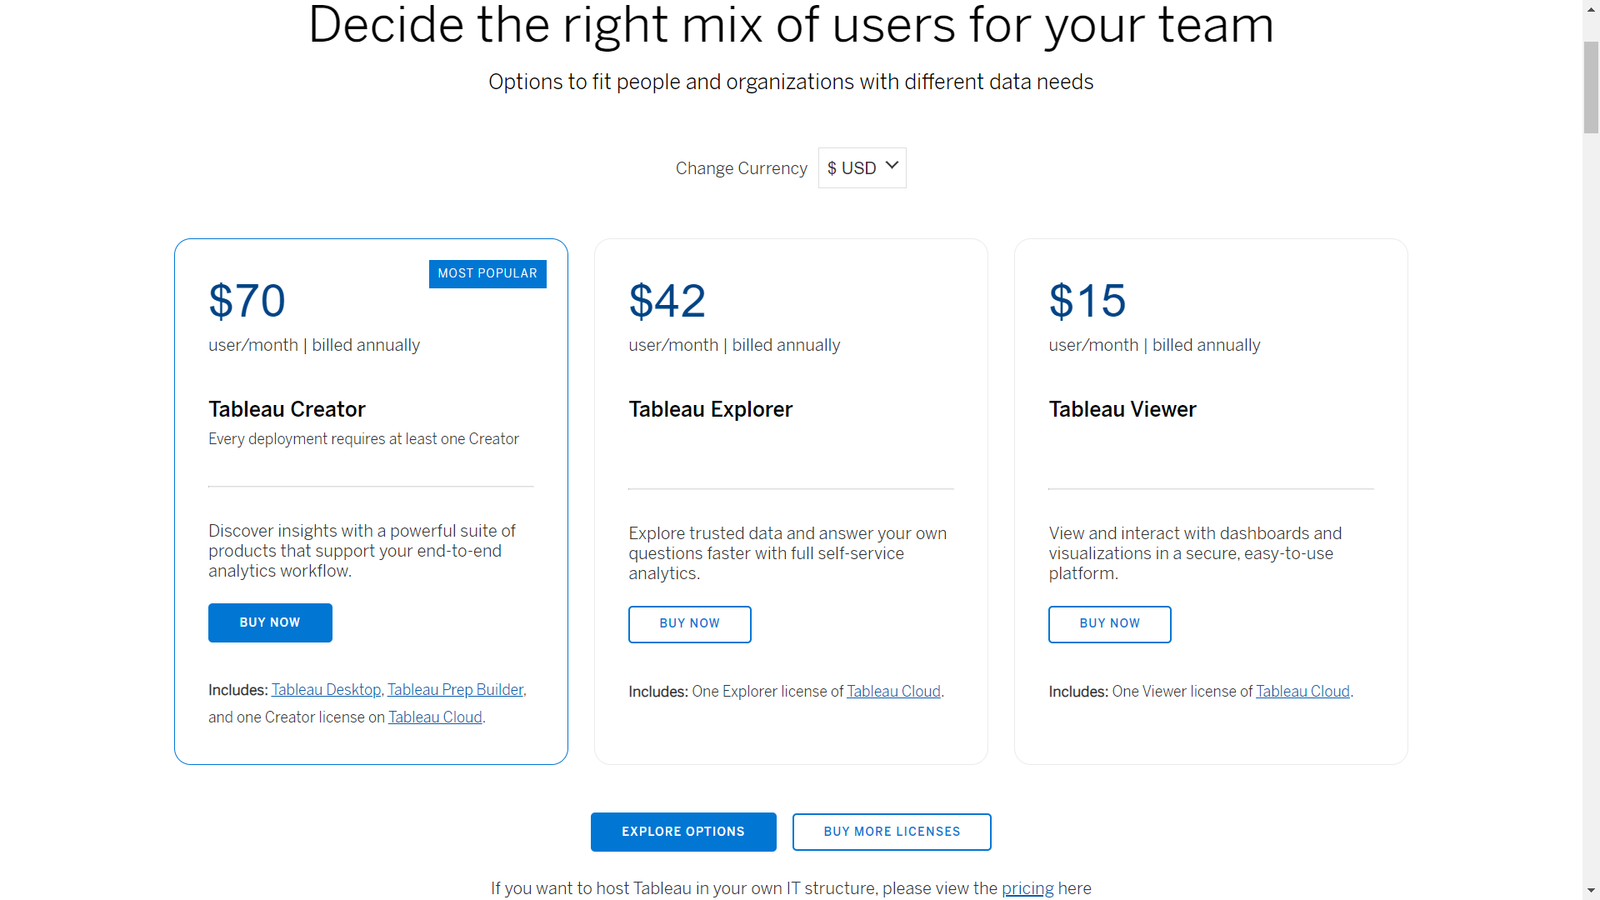
Tableau offers 3 plans: Tableau Creator ($70/user/month), Tableau Explorer ($42/user/month), and Tableau Viewer ($15/user/month).
Tableau Creator provides a suite of powerful products to support your end-to-end analytics workflow, including Tableau Desktop, Tableau Prep Builder, and one Creator license on Tableau Cloud.
For faster self-service analytics and the ability to explore trusted data, Tableau Explorer includes one Explorer license on Tableau Cloud. Tableau Viewer, on the other hand, allows users to securely view and interact with dashboards and visualizations on an easy-to-use platform.
Customer Thoughts
I use Tableau to turn complex data into presentable visual charts and graphs, which makes working with data a lot less boring and time-consuming.
For me, the biggest advantage Tableau has is its ability to pull data from many sources and combine them into a single dashboard.
After linking my data, Tableau quickly provides me with visualization choices that help me put the data to use.
I love how seamless linking existing databases is in Tableau.
Canceling a query takes more time than it should.
Tableau can be very complicated if you don’t have any prior coding knowledge.
Bottom Line
From where I stand, I believe Tableau is one of the most advanced reporting tools out there, despite being somewhat complex for the non-techies.
What Is a Reporting Tool?
A reporting tool is software that generates reports and visual charts of your data to make it easier to read and analyze. It can provide you with useful insights that help you improve your operations and team performance, as well as eliminate wasteful activities and reduce costs.
Why Your Business Needs a Reporting Tool
Businesses work with large amounts of data, and without proper tracking, your data analysts won’t be able to put it to good use.
A reporting tool basically serves as the bridge between raw data and actionable intelligence, enabling you to gain a comprehensive understanding of your operations, identify trends and patterns, make informed decisions and identify growth opportunities.
According to Statista, 64% of professionals think that data analytics has helped them maximize productivity and operational efficiency. It enables data-driven decision-making, performance monitoring and evaluation, operational efficiency, data visualization, compliance, and stakeholder communication.
Final Thoughts
That was a detailed overview of the best reporting tools for your business.
Depending on your use case, team size, and budget, you should be able to pick the right solution for your organization.
I definitely encourage you to try some of the tools I’ve reviewed with the free plans or trials before committing long-term. Nevertheless, if your business is still in its early stages, it might be a good idea to start with a free tool like Looker Studio.


