
Beginner’s Guide to Process Mapping
As W. Edwards Deming once said: “If you can’t describe what you’re doing as a process, then you don’t know what you’re doing.” That’s exactly what process mapping aims to do.
A process map provides a visual representation of the steps or activities of a process so you can make it more efficient. It’s a powerful tool that you can use in your business to display and improve your processes in a way that makes it easier for your mind to identify problems and brainstorm ideas.
This guide aims to help beginners learn about what process mapping is, why use it, and its types and tools.
What Is Process Mapping?
Process mapping is a technique for visualizing the flow of a process. A process map consists of a series of activities and events handled by humans and machines or computers.
Visualizing your processes using process mapping can help you identify possible areas for improvement. For illustration, think about your morning routine. You wake up in the morning, brush your teeth, have breakfast, put on your clothes, and head to work. This process is your “morning routine” and you can actually visualize it with process mapping.
Creating a process map for your “morning routine” may help you notice you’re wasting time looking for your cereal box during the “breakfast” activity, causing you to be late to work frequently.
A simple improvement here would be to put the box in the same kitchen cabinet every day so you won’t have to keep looking for it. The same process mapping technique is implemented in business process improvement.
Why Use a Process Map in Your Business?

Process mapping is a great tool to use for improving the efficiency of your business processes.
The purpose of process mapping is to help teams come up with new ideas for improvement by making it easier to spot redundant tasks, bottlenecks, and unnecessary delays. They also allow managers to define process ownership and boundaries, as well as the effectiveness of their metrics.
Some of the benefits of using a process map in your business include:
Training and Standardization
Process mapping is vital for creating Standard Operating Procedures (SOPs). SOPs make the process easier to understand for current and future employees. They also standardize the process flow across different teams and functions to maintain a consistent work methodology.
Process Improvement
Business process mapping provides an opportunity for improving processes. By visualizing the process steps and all the inputs and outputs, identifying potential areas for improvement becomes easier.
Communication
Process mapping can drastically improve team communications. Since process maps create a visual representation of the process flow and its key elements, communication becomes more effective. They also help employees understand what their responsibilities are throughout the process.
Auditing
Process mapping is considered a method for documenting processes, which can come in handy during internal or external audits.
Auditors seek to learn about the standard operating procedures and various workflows across your organization. Without documentation, you won’t be able to provide the required information needed to pass the audit.
Process mapping can also help you comply with ISO 9000 and ISO 9001 standards.
Decision Making
Visualizing processes can significantly support decision-making. By gaining clearer visibility of the process, you can make better decisions for your business.
Marketing
Process mapping is a great way to demonstrate how reliable your business processes for your industrial customers and investors. It’s a B2B marketing tool that can make investors more interested in what your business brings to the table.
Types of Business Process Maps
There are various types of process maps depending on the goal behind creating the process map and the nature of the process itself. These include:
Basic Flowchart
A basic flowchart shows the steps of a process with a combination of symbols joined by arrows. It’s one of the simplest process maps and is widely used in many organizations.
Value Stream Map (VSM)
A value stream map is a process map that helps managers identify the sources of waste in a process to eliminate or mitigate them.
Any activities that cost money or waste time without adding value are considered wasteful activities, and value stream mapping makes finding them easier.
Swimlane Diagram
A swimlane diagram is more or less a flowchart that’s dedicated to assigning tasks to individual employees or teams. This type of diagram is extensively used in project management.
Detailed Process Map
A detailed process map is a flowchart that elaborates the details of the sub-processes in a process.
The purpose of this map is to provide the inputs and outputs of every process step regardless of its significance to keep the decision points of a process documented.
Suppliers, Inputs, Process, Outputs, and Customers (SIPOC) Diagram
The SIPOC diagram isn’t classified as a process map in itself. It’s more of a preliminary step to creating a detailed flowchart or value stream map. It visualizes the vital elements of a process to make creating a process map more straightforward.
A SIPOC diagram consists of 5 columns that include the inputs and outputs of the process, as well as the suppliers and customers involved.
Deployment Map
A deployment map, also known as a cross-functional flowchart, helps identify the relationship across multiple teams.
A deployment map may include one or more swimlane diagrams to display the process flow for the purpose of identifying redundancies and bottlenecks.
Top-Down Process Map
A top-down or high-level process map provides an overview of a process, showing only the primary steps. This map doesn’t include extensive details about the process since it’s used to discuss project details with top managers or external parties that don’t need to know the specifics of the process.
Process Mapping Symbols

Process maps utilize visual representations or symbols to give a cue on what the process step means. These symbols can be rectangles, squares, ovals, or other geometric shapes.
For standardization purposes, the symbols either come from the Unified Modeling Language (UML) or Business Process Model and Notation (BPMN).
Here’s a list of some of the most commonly used symbols:
Terminator: An oval that determines the start or end of the process.
Process step: A rectangle means there’s a subprocess or activity within the process.
Flow: Arrows display the flow of the process and connect different steps.
Decision: A diamond is a point in the process that requires a decision. It’s usually a yes or no question.
Delay: A D-shaped symbol represents a process delay.
Information: A rectangle with a wavy bottom line indicates that the people involved in the process should read a document to access key information. If there are multiple stacked wavy bottom rectangles, this means there’s more than one document.
Data: A parallelogram is an input or output of the process step.
Manual input: A slanted top-line rectangle implies that manual data entry is required at this point of the process.
Subprocess: A rectangle with double vertical lines represents a predefined subprocess.
Tools for Process Mapping
Traditionally, process maps were created with the classic pen and paper, but with technological advancements, there are lots of software solutions that can help you create process maps in easier ways.
Some of the B2B SaaS solutions that have process mapping capabilities include:
Low-Code Business Automation Software
Workflow Management Software
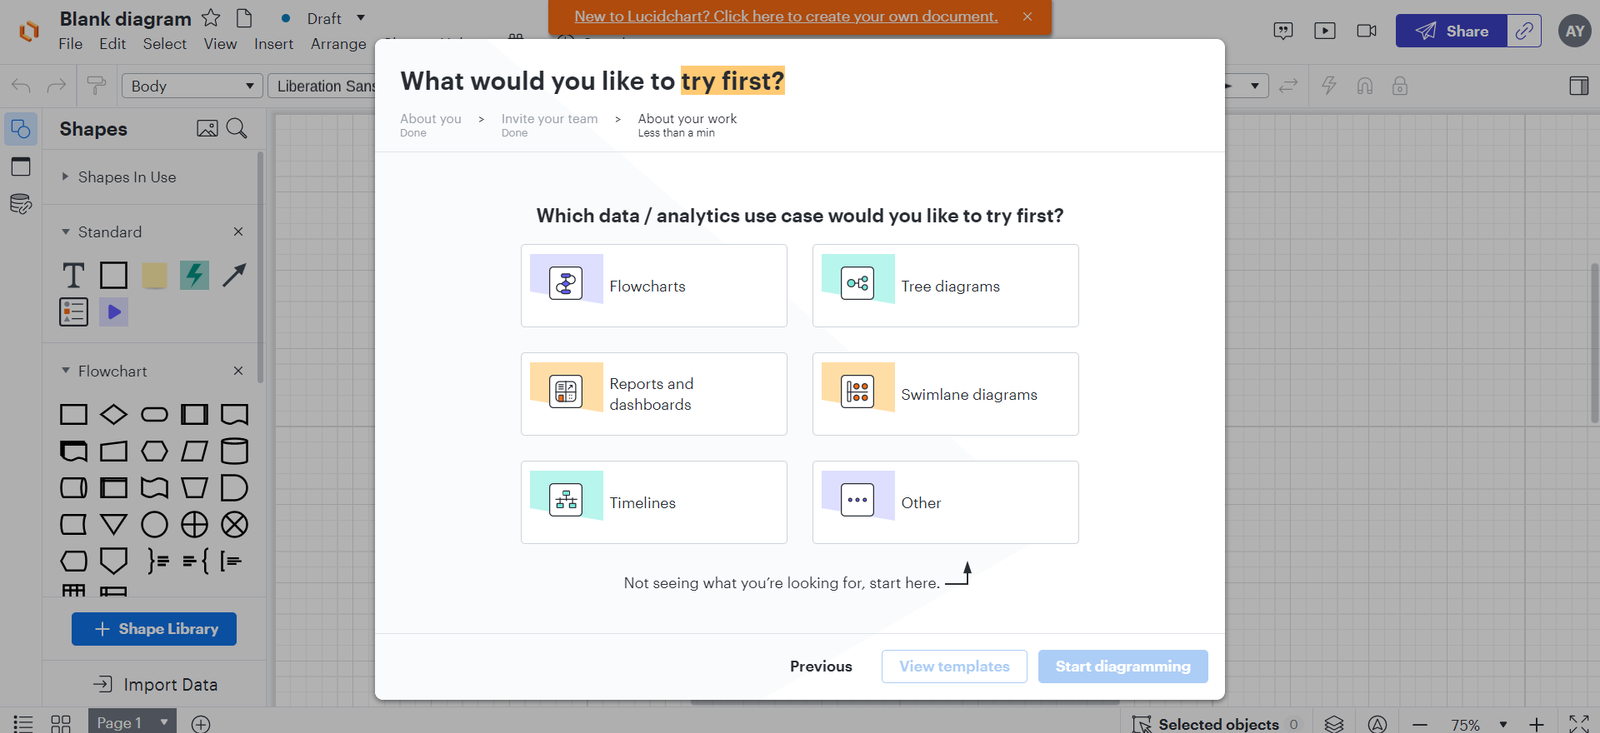
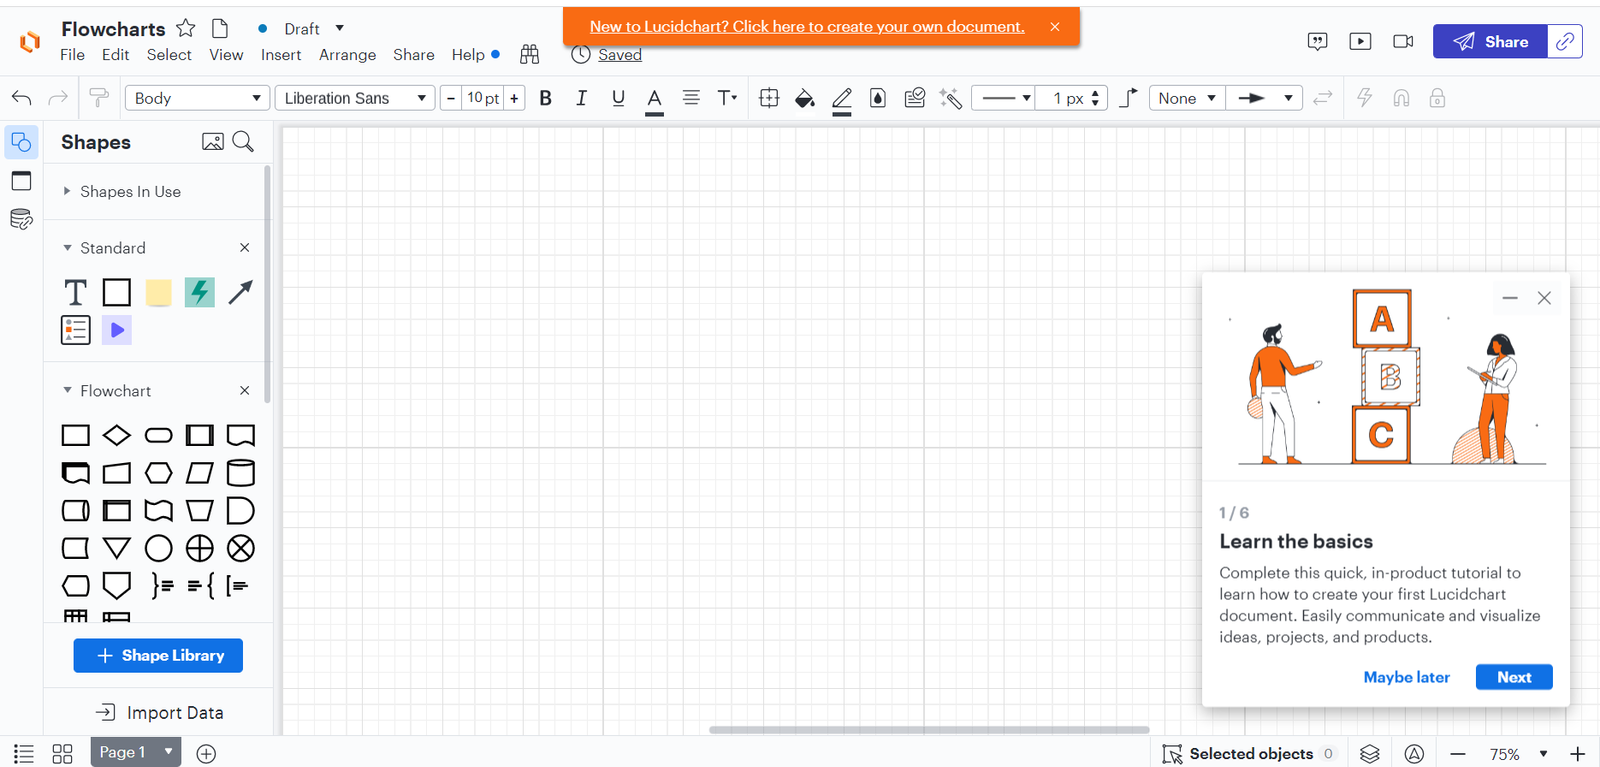
Getting started is easy. One of my favorite tools is LucidChart, a popular diagramming app. To create a process map in LucidChart, all you have to do is to create an account and add a new sheet.

Once you create an account, you’ll be prompted to choose the type of chart you want to try first.
Then, you can use drag-and-drop ready-made or custom process mapping symbols to build your process map. You can also add labels or comments for other team members to see, create and rearrange shapes, and format the process map to make it look exactly like you want.
Alternatively, you can use simple whiteboard or drawing apps to create basic process maps.
Summary
Process mapping will open your eyes to many improvement opportunities in your business that would otherwise be unnoticeable. And now that you have a better understanding of what process mapping is, you’re ready to build your first process map.
Identify the problem and brainstorm the activities that will be involved, then list the process steps in sequence and draw the symbols to finalize the process map.
You can either do everything manually with a pen and paper or digital whiteboard or use more advanced software with ready-made symbols and powerful customization and collaboration features.


